When Do Most Car Accidents Happen? New Jersey, Hour by Hour
Most car accidents in New Jersey happen on weekday afternoons between 3 and 6 pm, and Friday is the busiest day. Fatal crashes peak later, in the evening and after dark, and the weekend is deadliest per crash.
Hurt in a New Jersey crash at rush hour or after dark? The 30-second quiz asks a few short questions about your injury, fault and the date. A sponsoring lawyer or legal consultant may then call you.
Start the New Jersey accident quiz
Advertisement. Opens the New Jersey questionnaire. Review its policies and contact consent before submitting your details. No legal advice or guarantee of acceptance or compensation.
What time of day do most crashes happen?
The 3 to 6 pm window has the most injury accidents in New Jersey, and 5 pm is the single worst hour with 9,261 in two years.
See the full table
| Window | Injury or fatal accidents | Fatal crashes |
|---|---|---|
| 12 am to 3 am | 4,759 | 130 |
| 3 am to 6 am | 3,795 | 104 |
| 6 am to 9 am | 14,677 | 122 |
| 9 am to 12 pm | 14,997 | 119 |
| 12 pm to 3 pm | 20,501 | 147 |
| 3 pm to 6 pm | 26,821 | 177 |
| 6 pm to 9 pm | 17,437 | 236 |
| 9 pm to 12 am | 9,979 | 190 |
The injury curve follows the commute. It climbs from 1,029 accidents in the 4 am hour to 6,247 at 8 am, dips mid-morning, then peaks in the afternoon rush.
The peak hour has nine times the injury accidents of the quietest one.
Every hour of the day
| Hour starting | Injury or fatal accidents | Fatal crashes |
|---|---|---|
| 12 am | 1,927 | 56 |
| 1 am | 1,493 | 33 |
| 2 am | 1,339 | 41 |
| 3 am | 1,179 | 32 |
| 4 am | 1,029 | 30 |
| 5 am | 1,587 | 42 |
| 6 am | 3,094 | 45 |
| 7 am | 5,336 | 42 |
| 8 am | 6,247 | 35 |
| 9 am | 4,920 | 49 |
| 10 am | 4,646 | 40 |
| 11 am | 5,431 | 30 |
| 12 pm | 6,239 | 64 |
| 1 pm | 6,516 | 34 |
| 2 pm | 7,746 | 49 |
| 3 pm | 8,921 | 56 |
| 4 pm | 8,639 | 42 |
| 5 pm | 9,261 | 79 |
| 6 pm | 7,399 | 76 |
| 7 pm | 5,363 | 86 |
| 8 pm | 4,675 | 74 |
| 9 pm | 4,090 | 73 |
| 10 pm | 3,375 | 71 |
| 11 pm | 2,514 | 46 |
What day of the week has the most crashes?
Friday has the most accidents of every kind: 82,205 in total, 17,941 with someone hurt and 196 fatal. Friday is also deadliest by count, but Sunday is deadliest by rate.
See the full table
| Day | All accidents | Injury or fatal | Fatal |
|---|---|---|---|
| Monday | 74,778 | 16,192 | 173 |
| Tuesday | 79,541 | 16,831 | 150 |
| Wednesday | 77,669 | 16,780 | 174 |
| Thursday | 77,703 | 16,654 | 151 |
| Friday | 82,205 | 17,941 | 196 |
| Saturday | 66,268 | 15,183 | 191 |
| Sunday | 56,156 | 13,385 | 190 |
Weekends flip the pattern. Saturday and Sunday have the fewest accidents but the second and third most fatal crashes, 31 percent of fatal crashes from 24 percent of all accidents.
Per 1,000 recorded accidents, Sunday has 3.4 fatal crashes and Tuesday 1.9, so a Sunday crash is about 1.8 times as likely to be fatal.
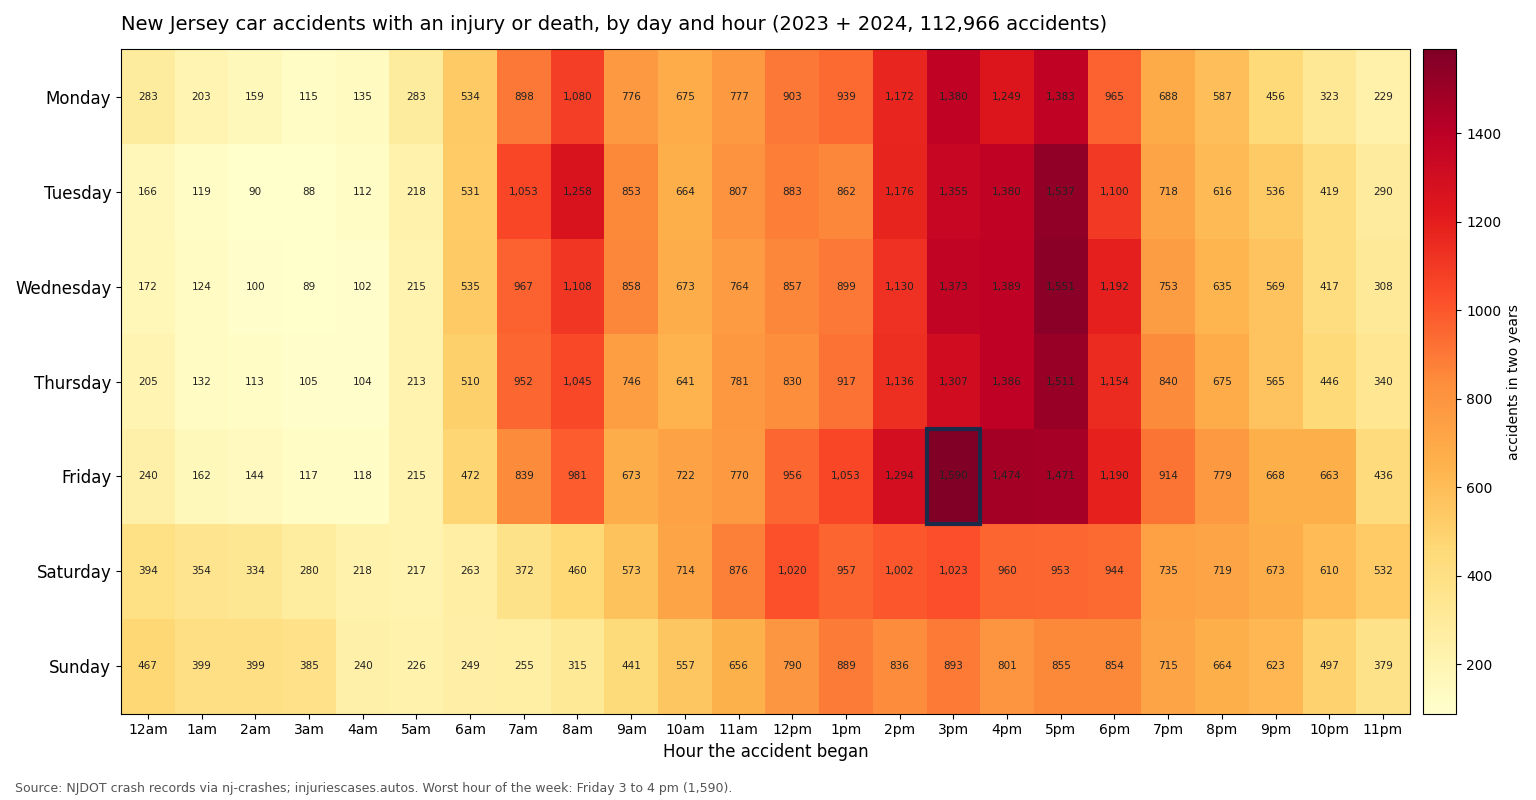
The five busiest hours of the week are all on weekday afternoons:
- Friday, 3 to 4 pm: 1,590 injury or fatal accidents
- Wednesday, 5 to 6 pm: 1,551
- Tuesday, 5 to 6 pm: 1,537
- Thursday, 5 to 6 pm: 1,511
- Friday, 4 to 5 pm: 1,474
Friday peaks two hours earlier than the other weekdays. For where these rush-hour accidents cluster, see the New Jersey intersections with the most injury crashes.
When do most fatal crashes happen?
Fatal crashes peak in the evening, not the rush: 7 pm has 86 of them, and 6 pm to midnight holds 35 percent of all fatal crashes.
The single deadliest slot of the week is Friday 10 to 11 pm, with 19 fatal crashes in two years. No other hour of the week reaches 16.
From 8 pm to 6 am: 41 percent of fatal crashes, 21 percent of injury accidents. Light conditions show the same split:
See the full table
| Light condition | Injury or fatal accidents | Fatal crashes |
|---|---|---|
| Daylight | 67% | 43% |
| Dark, street lights on | 23% | 37% |
| Dark, no street lights | 4% | 13% |
| Dusk or dawn | 5% | 5% |
| Dark, lights off, or unknown | 1% | 2% |
One in eight fatal crashes happens on a road with no street lighting at all, against one in twenty-five injury accidents.
- Hit on foot after dark: see our pedestrian crash guide for New Jersey.
- Crash with a drunk driver: see help after a drunk driving crash.
- Walking home in November: see how pedestrian crashes move into the evening after the clocks go back.
- For one town where night pedestrian deaths stand out, see Toms River crash records and the roads involved.
What month has the most crashes?
December has the most accidents overall, 48,036 in two years, while October has the most injury accidents and the most fatal crashes. Local roads follow the pattern too, as with December shopping crashes in Paramus.
See the full table
| Month | All accidents | Injury or fatal | Fatal |
|---|---|---|---|
| January | 38,542 | 8,108 | 91 |
| February | 36,455 | 7,728 | 85 |
| March | 40,357 | 8,764 | 84 |
| April | 39,765 | 8,960 | 90 |
| May | 45,599 | 10,390 | 89 |
| June | 43,106 | 9,505 | 117 |
| July | 43,146 | 9,597 | 91 |
| August | 41,984 | 9,597 | 110 |
| September | 42,429 | 9,590 | 107 |
| October | 47,057 | 10,419 | 137 |
| November | 47,844 | 10,173 | 122 |
| December | 48,036 | 10,135 | 102 |
Winter weather is not the reason. Snowy or icy roads appear in only 1,053 injury accidents, under 1 percent, while wet roads appear in 18,665, or 16.5 percent.
October and November also bring deer crashes; see our guide to hitting a deer in New Jersey.
Does the time of your accident affect your claim?
The time does not change New Jersey's fault rules, but it shapes the argument the other driver's insurer is likely to make.
| Argument | Where we cover it |
|---|---|
| "Rush hour, you were following too closely" | rear-end crash claims in New Jersey |
| "It was dark, you were not visible" | pedestrian crash guide and evidence that helps prove fault |
| "Weekend night, alcohol" | drunk driving crash help |
| "Deer season, unavoidable" | hitting a deer in New Jersey |
The police report records the hour the crash began, so check it first. A Parkway report costs $5, against $13 on other State Police roads; our guide to getting a New Jersey crash report lists fees and waits by agency.
For the full list of first steps, deadlines and who pays, start with our New Jersey car accident help hub.
Questions people ask
Was there a fatal accident in New Jersey yesterday?
Very likely. New Jersey recorded 1,225 fatal crashes in 2023 and 2024, about 1.7 a day, with the most on Fridays and weekends. We count records, not daily news.
Is the Garden State Parkway more dangerous down the shore?
Yes, per crash: 2.7 deaths per 100 injury accidents in its four southern counties, against 0.4 in the north. See the Parkway crash counts by milepost.
Which New Jersey intersection has the most crashes?
Route 30 (White Horse Pike) at Gibbsboro Road in Clementon: 25 injury crashes in 2024 and 2025, with 43 people hurt. See the most dangerous New Jersey intersections.
Was your accident in New Jersey? Answer a few short questions, about 30 seconds, and a sponsoring lawyer or legal consultant may call you about your claim.
Start the New Jersey accident quiz
Advertisement. Opens the New Jersey questionnaire. Review its policies and contact consent before submitting your details. No legal advice or guarantee of acceptance or compensation.
Sources
- NJDOT Crash Data Portal, crash records for 2023 and 2024, as normalized by the open-source nj-crashes project; fatal crashes checked against NJ State Police Fatal Crash Statistics.
How we counted
We counted 514,320 NJDOT crash records for 2023 and 2024, including 112,966 with someone hurt or killed and 1,225 fatal crashes. Hour is the hour the crash began on the police report; day and month come from the crash date.
These are recorded counts, not risk per mile driven, and a fatal crash can kill more than one person. Light and surface shares use records with a value in that field.