NJ deer crashes by county: towns, roads and hours (2023 to 2024) Jump to: Questions Sources By Sandra H. Brown, Injuries Cases Autos research. Updated 11 November 2026
Monmouth logged the most police-reported animal crashes in 2023 and 2024, 2,374, but Hunterdon has the highest share: 20.1 percent of all its crashes. Each county below lists its top towns, top road and worst hour.
Bridgewater: 117 October and November animal crashes, the most of any NJ town Middlesex: 113 fall animal crashes from 9 pm to midnight, more than at dusk (98) Union: 6.6 percent of animal crashes hurt someone, highest of 21 counties Gloucester: 46.6 percent of its animal crashes come in October and November Animal crashes by county, 2023 and 2024, sorted by count. Select a county to jump to its towns, roads and hours. County Animal crashes Share of all crashes October and November Worst town, October and November Top road Monmouth 2,374 7.3 percent 978 Middletown Township (112) Garden State Parkway (345) Burlington 1,535 6.9 percent 670 Mount Laurel Township (109) Route 206 (108) Somerset 1,515 7.6 percent 620 Bridgewater Township (117) Route 22 (157) Ocean 1,498 5.1 percent 619 Toms River Township (104) Garden State Parkway (181) Morris 1,467 5.8 percent 625 Parsippany-Troy Hills (60) I-80 (134) Hunterdon 1,458 20.1 percent 573 Raritan Township (115) Route 31 (181) Bergen 1,343 2.5 percent 505 Paramus Borough (47) Garden State Parkway (193) Middlesex 1,199 2.1 percent 515 Piscataway Township (78) Route 1 (86) Sussex 1,145 19.7 percent 405 Sparta Township (75) Route 206 (153) Gloucester 968 6.1 percent 451 Monroe Township (89) Route 55 (94) Mercer 830 3.9 percent 345 Hopewell Township (89) I-295 (116) Warren 774 15.5 percent 307 Washington Township (37) Route 57 (106) Atlantic 767 4.8 percent 285 Galloway Township (72) Garden State Parkway (58) Camden 719 2.6 percent 322 Cherry Hill Township (86) Route 73 (66) Passaic 594 1.7 percent 214 Wayne Township (69) Route 23 (41) Essex 513 1.1 percent 184 West Orange Township (33) I-280 (52) Cumberland 460 6.1 percent 186 Vineland City (61) Route 47 (31) Union 377 0.9 percent 142 Union Township (20) Garden State Parkway (58) Salem 327 10.1 percent 133 Carneys Point Township (24) Route 40 (28) Cape May 145 3.0 percent 44 Middle Township (16) Garden State Parkway (39) Hudson 74 0.2 percent 17 North Bergen Township (5) I-95 (9)
What to do after a deer strike, and who pays, is on our hit a deer in NJ guide .1
Hurt in a deer crash, or in a crash with another car while avoiding one? A 30-second questionnaire checks whether a lawyer's office may review your claim for free.
Start the New Jersey accident quiz
Advertisement. Opens the New Jersey questionnaire. Review its policies and contact consent before submitting your details. No legal advice or guarantee of acceptance or compensation.
Which North Jersey counties have the most deer crashes? Morris logged the most, 1,467. Sussex and Warren have the highest shares; in Hudson, Union and Essex, animal crashes are rare.
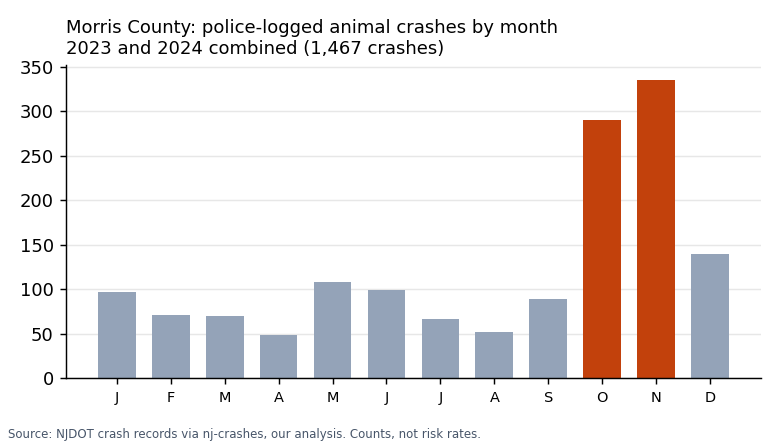
Morris County In Washington Township, 23.3 percent of crashes involved an animal, nearly 1 in 4, the highest of any sizeable Morris town. Animal crashes jumped 22 percent from 2023 to 2024. Morris County at a glance, 2023 and 2024 (our count) Measure Morris New Jersey Animal crashes, 2023 and 2024 1,467 20,082 Animal share of all crashes 5.8 percent (10th of 21) 3.9 percent In October and November 625 (42.6 percent) 8,140 (41 percent) 2023, 2024, 2025 (preliminary) 661, 806, 860 9,598, 10,484, 10,774 Worst month (both years) November (335) November (4,330) Worst hour, October and November 6 pm to 7 pm (75) 6 pm to 7 pm 5 pm to 8 pm share, October and November 30.9 percent 28 percent In the dark, October and November 65.0 percent 66 percent Someone hurt or killed 65 crashes (4.4 percent) 914 (4.6 percent) Top road for animal crashes I-80 (134)Clocks back: 5 pm to 8 pm, two weeks before and after 56 to 83 582 to 900 Monday after the clocks fell back (2023, 2024) 8 and 10, against 5.1 on an average fall day 120 and 127
Top 5 Morris towns for October and November animal crashes, 2023 and 2024
Bars show Animal crashes, two years
Parsippany-Troy Hills 140 Washington Township 130 Mount Olive Township 116 Randolph Township 108 Roxbury Township 86 See the full table Swipe for more columns →
Top 5 Morris towns for October and November animal crashes, 2023 and 20241 Town October and November Animal crashes, two years All crashes Animal share Parsippany-Troy Hills 60 140 4,059 3.4 percent Randolph Township 50 108 1,289 8.4 percent Mount Olive Township 48 116 1,355 8.6 percent Washington Township 45 130 559 23.3 percent Roxbury Township 36 86 1,650 5.2 percent
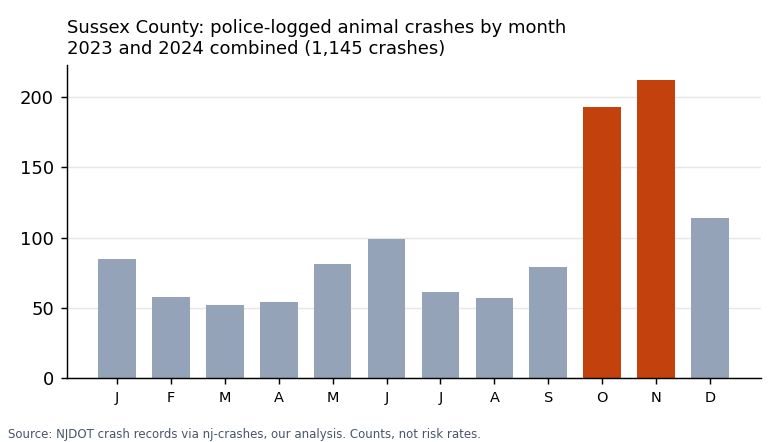
Morris County animal crashes by month, 2023 and 2024 combined. October and November in orange. Our NJDOT count. Sussex County 37 percent of fall animal crashes came between 5 pm and 8 pm, the most concentrated dusk window of all 21 counties (statewide 28 percent). About 1 in 5 crashes involves an animal, 2nd only to Hunterdon; in Frankford, 1 in 3. Sussex County at a glance, 2023 and 2024 (our count) Measure Sussex New Jersey Animal crashes, 2023 and 2024 1,145 20,082 Animal share of all crashes 19.7 percent (2nd of 21) 3.9 percent In October and November 405 (35.4 percent) 8,140 (41 percent) 2023, 2024, 2025 (preliminary) 539, 606, 589 9,598, 10,484, 10,774 Worst month (both years) November (212) November (4,330) Worst hour, October and November 6 pm to 7 pm (70) 6 pm to 7 pm 5 pm to 8 pm share, October and November 37.0 percent 28 percent In the dark, October and November 64.0 percent 66 percent Someone hurt or killed 30 crashes (2.6 percent) 914 (4.6 percent) Top road for animal crashes Route 206 (153)Clocks back: 5 pm to 8 pm, two weeks before and after 35 to 60 582 to 900 Monday after the clocks fell back (2023, 2024) 5 and 7, against 3.3 on an average fall day 120 and 127
Top 5 Sussex towns for October and November animal crashes, 2023 and 2024
Bars show Animal crashes, two years
Sparta Township 198 Frankford Township 125 Wantage Township 107 Vernon Township 99 Hardyston Township 77 See the full table Swipe for more columns →
Top 5 Sussex towns for October and November animal crashes, 2023 and 20241 Town October and November Animal crashes, two years All crashes Animal share Sparta Township 75 198 1,053 18.8 percent Frankford Township 43 125 374 33.4 percent Vernon Township 37 99 451 22.0 percent Hardyston Township 36 77 335 23.0 percent Wantage Township 32 107 443 24.2 percent
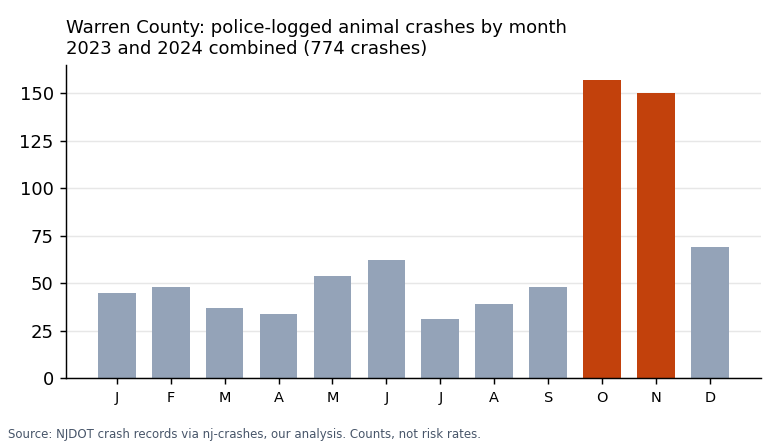
Sussex County animal crashes by month, 2023 and 2024 combined. October and November in orange. Our NJDOT count. Warren County Preliminary 2025 shows 471 animal crashes, 15.4 percent above 2024 (about 15 percent), the 2nd biggest rise of 21 counties. 15.5 percent of crashes involve an animal, 3rd highest in NJ; in Blairstown 34 percent, in Mansfield 26 percent. Warren County at a glance, 2023 and 2024 (our count) Measure Warren New Jersey Animal crashes, 2023 and 2024 774 20,082 Animal share of all crashes 15.5 percent (3rd of 21) 3.9 percent In October and November 307 (39.7 percent) 8,140 (41 percent) 2023, 2024, 2025 (preliminary) 366, 408, 471 9,598, 10,484, 10,774 Worst month (both years) October (157) November (4,330) Worst hour, October and November 6 pm to 7 pm (41) 6 pm to 7 pm 5 pm to 8 pm share, October and November 31.9 percent 28 percent In the dark, October and November 67.8 percent 66 percent Someone hurt or killed 28 crashes (3.6 percent) 914 (4.6 percent) Top road for animal crashes Route 57 (106) Clocks back: 5 pm to 8 pm, two weeks before and after 30 to 32 582 to 900 Monday after the clocks fell back (2023, 2024) 5 and 6, against 2.5 on an average fall day 120 and 127
Top 5 Warren towns for October and November animal crashes, 2023 and 2024
Bars show Animal crashes, two years
Mansfield Township 79 Washington Township 75 Blairstown Township 73 White Township 65 Knowlton Township 53 See the full table Swipe for more columns →
Top 5 Warren towns for October and November animal crashes, 2023 and 20241 Town October and November Animal crashes, two years All crashes Animal share Washington Township 37 75 355 21.1 percent White Township 29 65 276 23.6 percent Mansfield Township 27 79 305 25.9 percent Knowlton Township 27 53 394 13.5 percent Blairstown Township 26 73 214 34.1 percent
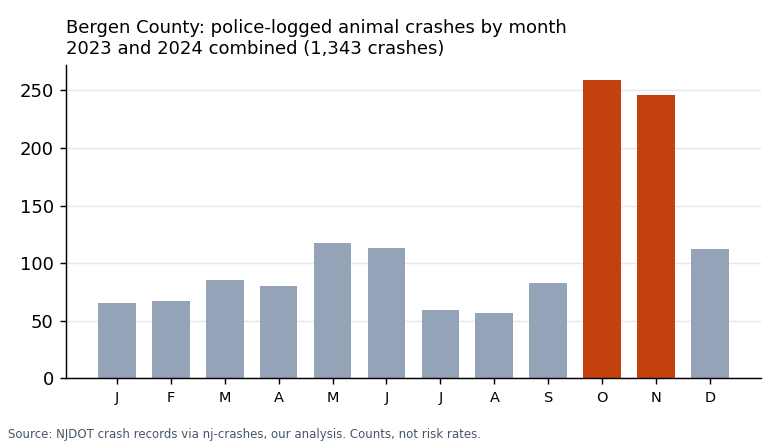
Warren County animal crashes by month, 2023 and 2024 combined. October and November in orange. Our NJDOT count. Bergen County The morning commute matters as much as dusk: 7 am to 8 am ties 7 pm to 8 pm as the worst fall hour. Alpine (28.1 percent) and Franklin Lakes (15.4 percent) have the highest animal shares, against 2.5 percent countywide. Bergen County at a glance, 2023 and 2024 (our count) Measure Bergen New Jersey Animal crashes, 2023 and 2024 1,343 20,082 Animal share of all crashes 2.5 percent (16th of 21) 3.9 percent In October and November 505 (37.6 percent) 8,140 (41 percent) 2023, 2024, 2025 (preliminary) 613, 730, 761 9,598, 10,484, 10,774 Worst month (both years) October (259) November (4,330) Worst hour, October and November 7 am to 8 am and 7 pm to 8 pm (41 each) 6 pm to 7 pm 5 pm to 8 pm share, October and November 22.6 percent 28 percent In the dark, October and November 61.4 percent 66 percent Someone hurt or killed 64 crashes (4.8 percent) 914 (4.6 percent) Top road for animal crashes Garden State Parkway (193)Clocks back: 5 pm to 8 pm, two weeks before and after 37 to 42 582 to 900 Monday after the clocks fell back (2023, 2024) 7 and 5, against 4.1 on an average fall day 120 and 127
Top 5 Bergen towns for October and November animal crashes, 2023 and 2024
Bars show Animal crashes, two years
Paramus Borough 130 Mahwah Township 107 Alpine Borough 84 Franklin Lakes Borough 60 Washington Township 54 See the full table Swipe for more columns →
Top 5 Bergen towns for October and November animal crashes, 2023 and 20241 Town October and November Animal crashes, two years All crashes Animal share Paramus Borough 47 130 4,338 3.0 percent Mahwah Township 45 107 1,331 8.0 percent Franklin Lakes Borough 31 60 389 15.4 percent Alpine Borough 28 84 299 28.1 percent Washington Township 24 54 427 12.6 percent
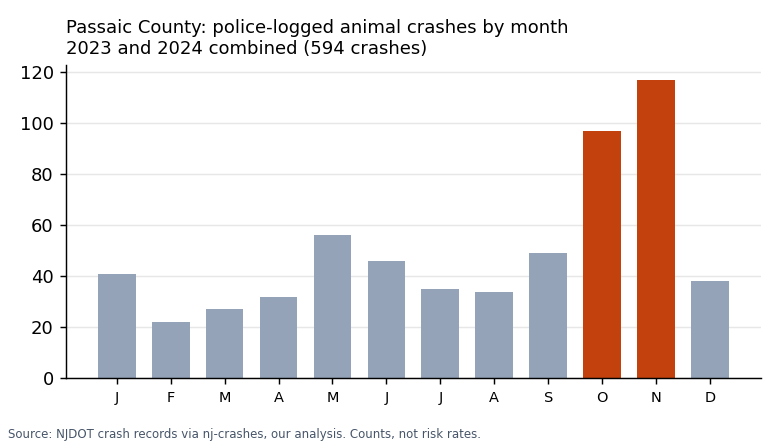
Bergen County animal crashes by month, 2023 and 2024 combined. October and November in orange. Our NJDOT count. Passaic County West Milford's animal share, 13.5 percent, is eight times the county's; Ringwood's is 12 percent. Wayne logged the most animal crashes in the county. Passaic County at a glance, 2023 and 2024 (our count) Measure Passaic New Jersey Animal crashes, 2023 and 2024 594 20,082 Animal share of all crashes 1.7 percent (18th of 21) 3.9 percent In October and November 214 (36.0 percent) 8,140 (41 percent) 2023, 2024, 2025 (preliminary) 261, 333, 353 9,598, 10,484, 10,774 Worst month (both years) November (117) November (4,330) Worst hour, October and November 7 pm to 8 pm (23) 6 pm to 7 pm 5 pm to 8 pm share, October and November 26.6 percent 28 percent In the dark, October and November 57.5 percent 66 percent Someone hurt or killed 27 crashes (4.5 percent) 914 (4.6 percent) Top road for animal crashes Route 23 (41)Monday after the clocks fell back (2023, 2024) 2 and 6, against 1.8 on an average fall day 120 and 127
Top 5 Passaic towns for October and November animal crashes, 2023 and 2024
Bars show Animal crashes, two years
Wayne Township 192 West Milford Township 79 Clifton City 78 Ringwood Borough 56 Little Falls Township 28 See the full table Swipe for more columns →
Top 5 Passaic towns for October and November animal crashes, 2023 and 20241 Town October and November Animal crashes, two years All crashes Animal share Wayne Township 69 192 3,828 5.0 percent West Milford Township 30 79 585 13.5 percent Clifton City 21 78 8,897 0.9 percent Ringwood Borough 19 56 467 12.0 percent Little Falls Township 14 28 1,104 2.5 percent
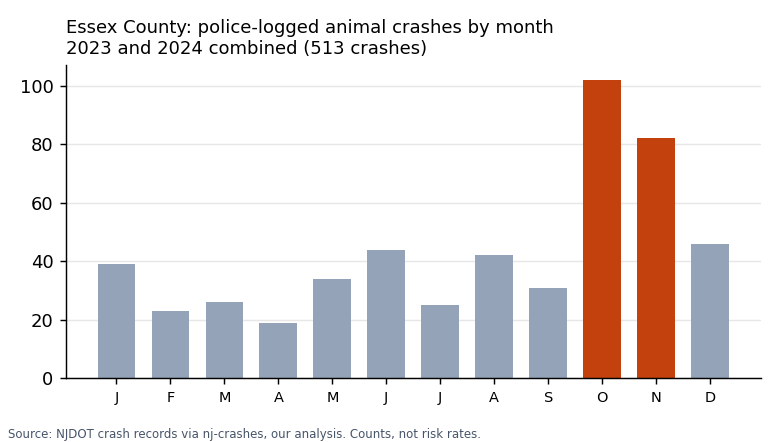
Passaic County animal crashes by month, 2023 and 2024 combined. October and November in orange. Our NJDOT count. Essex County Cedar Grove's animal share, 10.8 percent (62 of 576 crashes), is 10 times the county's 1.1 percent. West Orange and Livingston lead for fall crashes. Essex County at a glance, 2023 and 2024 (our count) Measure Essex New Jersey Animal crashes, 2023 and 2024 513 20,082 Animal share of all crashes 1.1 percent (19th of 21) 3.9 percent In October and November 184 (35.9 percent) 8,140 (41 percent) 2023, 2024, 2025 (preliminary) 217, 296, 258 9,598, 10,484, 10,774 Worst month (both years) October (102) November (4,330) Worst hour, October and November 5 pm to 6 pm (22) 6 pm to 7 pm 5 pm to 8 pm share, October and November 26.6 percent 28 percent In the dark, October and November 65.8 percent 66 percent Someone hurt or killed 27 crashes (5.3 percent) 914 (4.6 percent) Top road for animal crashes I-280 (52)Clocks back: 5 pm to 8 pm, two weeks before and after 15 to 19 582 to 900 Monday after the clocks fell back (2023, 2024) 1 and 6, against 1.5 on an average fall day 120 and 127
Top 5 Essex towns for October and November animal crashes, 2023 and 2024
Bars show Animal crashes, two years
West Orange Township 87 Livingston Township 82 Cedar Grove Township 62 Roseland Borough 43 Millburn Township 36 See the full table Swipe for more columns →
Top 5 Essex towns for October and November animal crashes, 2023 and 20241 Town October and November Animal crashes, two years All crashes Animal share West Orange Township 33 87 2,532 3.4 percent Livingston Township 29 82 1,463 5.6 percent Cedar Grove Township 18 62 576 10.8 percent Roseland Borough 18 43 563 7.6 percent Millburn Township 18 36 1,344 2.7 percent
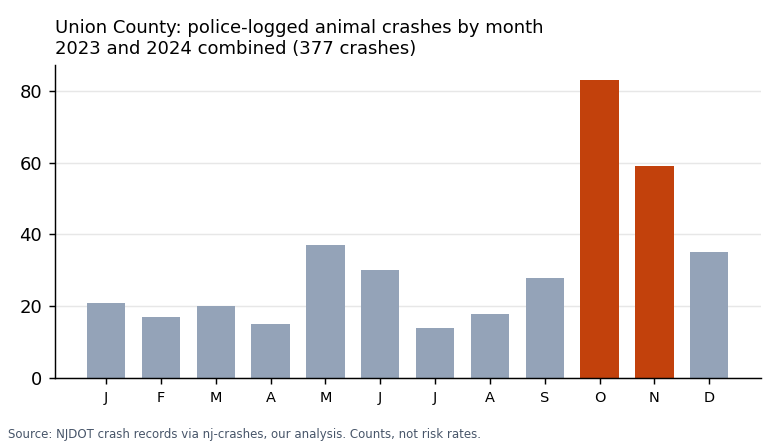
Essex County animal crashes by month, 2023 and 2024 combined. October and November in orange. Our NJDOT count. Union County Under 1 percent of crashes involve an animal (0.9 percent, 2nd lowest in NJ), yet 6.6 percent of them hurt someone, the highest of 21 counties (statewide 4.6 percent), with 31 people hurt. 71 percent of fall animal crashes happened in the dark. Union County at a glance, 2023 and 2024 (our count) Measure Union New Jersey Animal crashes, 2023 and 2024 377 20,082 Animal share of all crashes 0.9 percent (20th of 21) 3.9 percent In October and November 142 (37.7 percent) 8,140 (41 percent) 2023, 2024, 2025 (preliminary) 190, 187, 187 9,598, 10,484, 10,774 Worst month (both years) October (83) November (4,330) Worst hour, October and November 6 pm to 7 pm (19) 6 pm to 7 pm 5 pm to 8 pm share, October and November 28.2 percent 28 percent In the dark, October and November 71.1 percent 66 percent Someone hurt or killed 25 crashes (6.6 percent) 914 (4.6 percent) Top road for animal crashes Garden State Parkway (58)
Top 5 Union towns for October and November animal crashes, 2023 and 2024
Bars show Animal crashes, two years
Union Township 60 Springfield Township 32 Scotch Plains Township 30 Clark Township 27 Summit City 26 See the full table Swipe for more columns →
Top 5 Union towns for October and November animal crashes, 2023 and 20241 Town October and November Animal crashes, two years All crashes Animal share Union Township 20 60 6,696 0.9 percent Summit City 16 26 1,179 2.2 percent Clark Township 13 27 1,535 1.8 percent Springfield Township 12 32 1,969 1.6 percent Scotch Plains Township 11 30 826 3.6 percent
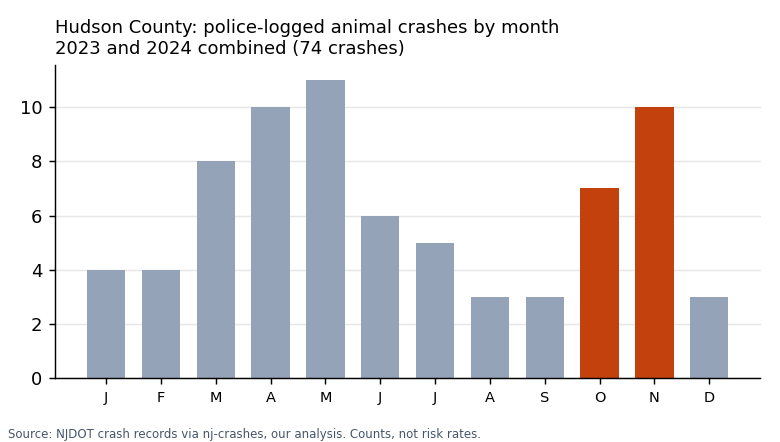
Union County animal crashes by month, 2023 and 2024 combined. October and November in orange. Our NJDOT count. Hudson County The lowest animal share of all 21 counties: 74 of 33,195 crashes. Its worst month was May (11), not November. Only 17 of the 74 came in October and November, against 41 percent statewide. Drivers heading west meet the deer belt in Morris, Somerset and Hunterdon. Hudson County at a glance, 2023 and 2024 (our count) Measure Hudson New Jersey Animal crashes, 2023 and 2024 74 20,082 Animal share of all crashes 0.2 percent (21st of 21) 3.9 percent In October and November 17 (23.0 percent) 8,140 (41 percent) 2023, 2024, 2025 (preliminary) 38, 36, 31 9,598, 10,484, 10,774 Worst month (both years) May (11) November (4,330) Worst hour, October and November 8 am to 9 am and 5 pm to 6 pm and 7 pm to 8 pm (2 each) 6 pm to 7 pm 5 pm to 8 pm share, October and November 29.4 percent 28 percent In the dark, October and November 58.8 percent 66 percent Someone hurt or killed 4 crashes (5.4 percent) 914 (4.6 percent) Top road for animal crashes I-95 (9)
Top 4 Hudson towns for October and November animal crashes, 2023 and 2024
Bars show Animal crashes, two years
Kearny Town 19 Jersey City 16 Secaucus Town 11 North Bergen Township 10 See the full table Swipe for more columns →
Top 4 Hudson towns for October and November animal crashes, 2023 and 20241 Town October and November Animal crashes, two years All crashes Animal share North Bergen Township 5 10 4,530 0.2 percent Kearny Town 4 19 3,750 0.5 percent Jersey City 4 16 12,420 0.1 percent Secaucus Town 4 11 2,099 0.5 percent
Hudson County animal crashes by month, 2023 and 2024 combined. October and November in orange. Our NJDOT count. Where do deer crashes cluster in Central Jersey? Two of the state's three busiest fall deer towns are here: Bridgewater in Somerset and Raritan Township in Hunterdon.
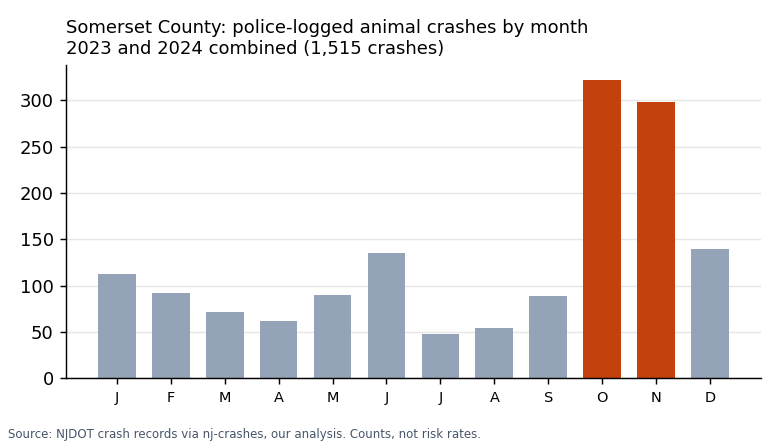
Somerset County Bridgewater's 117 fall animal crashes were the most of New Jersey's more than 500 towns. In Branchburg (26.8 percent) and Montgomery (24.1 percent), about a quarter of all crashes involve an animal. Worst fall hour: 5 pm to 6 pm. Somerset County at a glance, 2023 and 2024 (our count) Measure Somerset New Jersey Animal crashes, 2023 and 2024 1,515 20,082 Animal share of all crashes 7.6 percent (5th of 21) 3.9 percent In October and November 620 (40.9 percent) 8,140 (41 percent) 2023, 2024, 2025 (preliminary) 734, 781, 799 9,598, 10,484, 10,774 Worst month (both years) October (322) November (4,330) Worst hour, October and November 5 pm to 6 pm (69) 6 pm to 7 pm 5 pm to 8 pm share, October and November 30.8 percent 28 percent In the dark, October and November 68.2 percent 66 percent Someone hurt or killed 54 crashes (3.6 percent) 914 (4.6 percent) Top road for animal crashes Route 22 (157)Clocks back: 5 pm to 8 pm, two weeks before and after 49 to 61 582 to 900 Monday after the clocks fell back (2023, 2024) 5 and 5, against 5.1 on an average fall day 120 and 127
Top 5 Somerset towns for October and November animal crashes, 2023 and 2024
Bars show Animal crashes, two years
Bridgewater Township 260 Hillsborough Township 254 Franklin Township 235 Branchburg Township 204 Montgomery Township 189 See the full table Swipe for more columns →
Top 5 Somerset towns for October and November animal crashes, 2023 and 20241 Town October and November Animal crashes, two years All crashes Animal share Bridgewater Township 117 260 3,495 7.4 percent Franklin Township 99 235 4,440 5.3 percent Branchburg Township 94 204 762 26.8 percent Hillsborough Township 81 254 1,550 16.4 percent Montgomery Township 76 189 784 24.1 percent
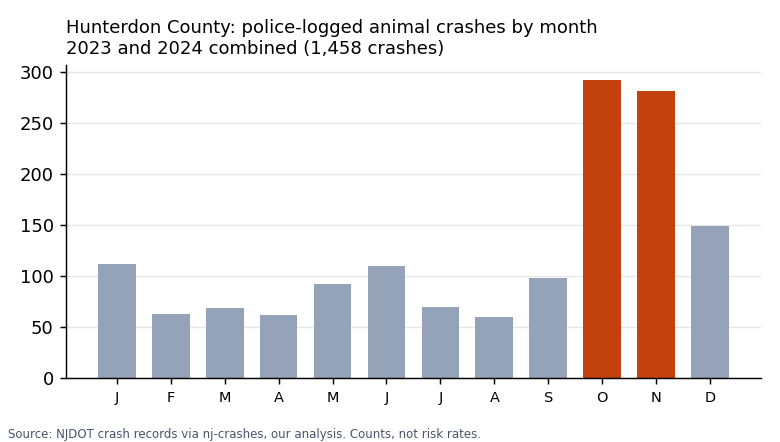
Somerset County animal crashes by month, 2023 and 2024 combined. October and November in orange. Our NJDOT count. Hunterdon County Highest animal share of all 21 counties, and higher still in the small Amwells: 72 of 166 crashes in West Amwell, 62 of 210 in East Amwell. Raritan Township's 115 fall animal crashes were the 2nd most of any NJ town. One in three fall animal crashes came between 5 pm and 8 pm. Hunterdon County at a glance, 2023 and 2024 (our count) Measure Hunterdon New Jersey Animal crashes, 2023 and 2024 1,458 20,082 Animal share of all crashes 20.1 percent (1st of 21) 3.9 percent In October and November 573 (39.3 percent) 8,140 (41 percent) 2023, 2024, 2025 (preliminary) 682, 776, 784 9,598, 10,484, 10,774 Worst month (both years) October (292) November (4,330) Worst hour, October and November 6 pm to 7 pm (69) 6 pm to 7 pm 5 pm to 8 pm share, October and November 33.3 percent 28 percent In the dark, October and November 68.9 percent 66 percent Someone hurt or killed 71 crashes (4.9 percent) 914 (4.6 percent) Top road for animal crashes Route 31 (181)Clocks back: 5 pm to 8 pm, two weeks before and after 56 to 65 582 to 900 Monday after the clocks fell back (2023, 2024) 12 and 9, against 4.7 on an average fall day 120 and 127
Top 5 Hunterdon towns for October and November animal crashes, 2023 and 2024
Bars show Animal crashes, two years
Raritan Township 284 Readington Township 275 Clinton Township 180 West Amwell Township 72 East Amwell Township 62 See the full table Swipe for more columns →
Top 5 Hunterdon towns for October and November animal crashes, 2023 and 20241 Town October and November Animal crashes, two years All crashes Animal share Raritan Township 115 284 1,267 22.4 percent Readington Township 107 275 910 30.2 percent Clinton Township 94 180 930 19.4 percent West Amwell Township 30 72 166 43.4 percent East Amwell Township 28 62 210 29.5 percent
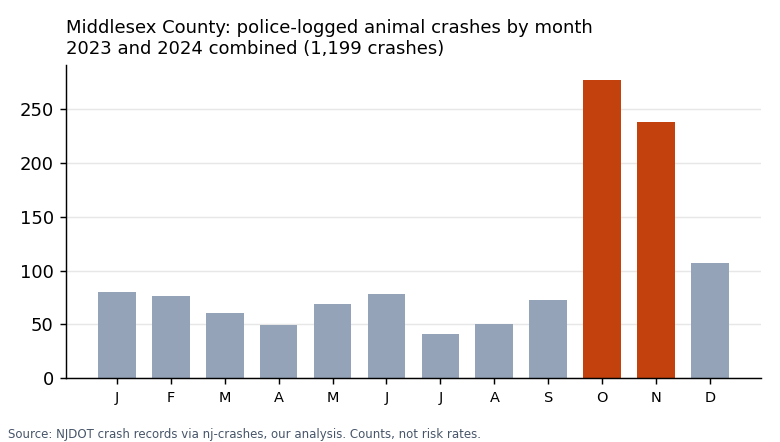
Hunterdon County animal crashes by month, 2023 and 2024 combined. October and November in orange. Our NJDOT count. Middlesex County The only county where late evening beats dusk: 113 October and November animal crashes between 9 pm and midnight, against 98 between 5 pm and 8 pm. 71 percent of them were in the dark. The two months hold 43 percent of animal crashes, 4th highest share. Middlesex County at a glance, 2023 and 2024 (our count) Measure Middlesex New Jersey Animal crashes, 2023 and 2024 1,199 20,082 Animal share of all crashes 2.1 percent (17th of 21) 3.9 percent In October and November 515 (43.0 percent) 8,140 (41 percent) 2023, 2024, 2025 (preliminary) 552, 647, 657 9,598, 10,484, 10,774 Worst month (both years) October (277) November (4,330) Worst hour, October and November 9 pm to 10 pm (43) 6 pm to 7 pm 5 pm to 8 pm share, October and November 19.0 percent 28 percent In the dark, October and November 70.7 percent 66 percent Someone hurt or killed 50 crashes (4.2 percent) 914 (4.6 percent) Top road for animal crashes Route 1 (86)Clocks back: 5 pm to 8 pm, two weeks before and after 30 to 40 582 to 900 Monday after the clocks fell back (2023, 2024) 6 and 7, against 4.2 on an average fall day 120 and 127
Top 5 Middlesex towns for October and November animal crashes, 2023 and 2024
Bars show Animal crashes, two years
Piscataway Township 173 South Brunswick Township 140 Woodbridge Township 130 Old Bridge Township 116 Edison Township 107 See the full table Swipe for more columns →
Top 5 Middlesex towns for October and November animal crashes, 2023 and 20241 Town October and November Animal crashes, two years All crashes Animal share Piscataway Township 78 173 3,823 4.5 percent South Brunswick Township 64 140 3,520 4.0 percent Woodbridge Township 61 130 10,147 1.3 percent Edison Township 50 107 8,552 1.3 percent Old Bridge Township 48 116 3,597 3.2 percent
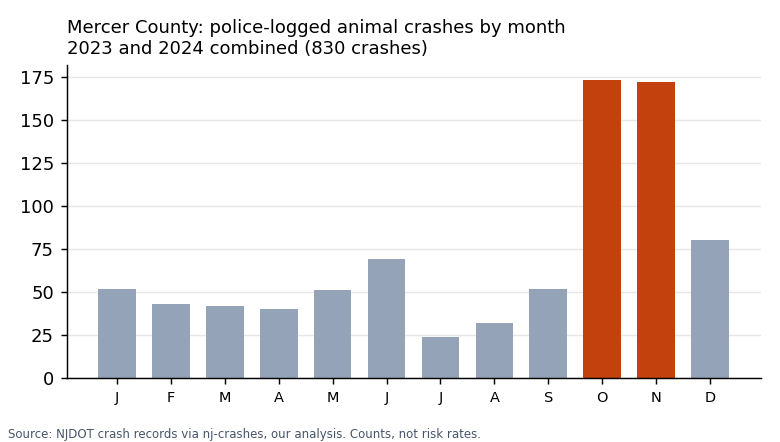
Middlesex County animal crashes by month, 2023 and 2024 combined. October and November in orange. Our NJDOT count. Mercer County In Hopewell Township, more than 1 in 5 crashes involved an animal, against 3.9 percent across the county. October, not November, is the worst month. Mercer County at a glance, 2023 and 2024 (our count) Measure Mercer New Jersey Animal crashes, 2023 and 2024 830 20,082 Animal share of all crashes 3.9 percent (13th of 21) 3.9 percent In October and November 345 (41.6 percent) 8,140 (41 percent) 2023, 2024, 2025 (preliminary) 397, 433, 450 9,598, 10,484, 10,774 Worst month (both years) October (173) November (4,330) Worst hour, October and November 6 pm to 7 pm (38) 6 pm to 7 pm 5 pm to 8 pm share, October and November 26.7 percent 28 percent In the dark, October and November 63.5 percent 66 percent Someone hurt or killed 30 crashes (3.6 percent) 914 (4.6 percent) Top road for animal crashes I-295 (116)Clocks back: 5 pm to 8 pm, two weeks before and after 29 to 37 582 to 900 Monday after the clocks fell back (2023, 2024) 3 and 5, against 2.8 on an average fall day 120 and 127
Top 5 Mercer towns for October and November animal crashes, 2023 and 2024
Bars show Animal crashes, two years
Hopewell Township 221 Hamilton Township 136 West Windsor Township 133 Ewing Township 111 Robbinsville Township 65 See the full table Swipe for more columns →
Top 5 Mercer towns for October and November animal crashes, 2023 and 20241 Town October and November Animal crashes, two years All crashes Animal share Hopewell Township 89 221 1,000 22.1 percent Hamilton Township 60 136 5,672 2.4 percent West Windsor Township 58 133 1,884 7.1 percent Ewing Township 36 111 1,697 6.5 percent Robbinsville Township 33 65 1,004 6.5 percent
Mercer County animal crashes by month, 2023 and 2024 combined. October and November in orange. Our NJDOT count. Which Shore county has the most deer crashes? Monmouth, with the most in New Jersey. The Garden State Parkway is the top road in both Shore counties.
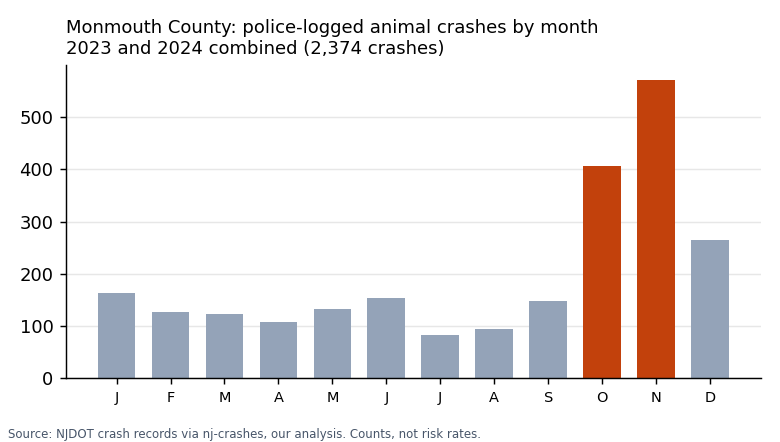
Monmouth County Most of all 21 counties. Worst day: Monday 6 November 2023, after the clocks changed, with 21 crashes against about 8 on an average fall day. The clocks went back again on 1 November 2026. Middletown (112), Marlboro (111) and Wall (109) rank 3rd, 4th and joint 5th among NJ towns for fall animal crashes: 3 of the top 6. In Colts Neck, 116 of 534 crashes (22 percent) involved an animal. Monmouth County at a glance, 2023 and 2024 (our count) Measure Monmouth New Jersey Animal crashes, 2023 and 2024 2,374 20,082 Animal share of all crashes 7.3 percent (6th of 21) 3.9 percent In October and November 978 (41.2 percent) 8,140 (41 percent) 2023, 2024, 2025 (preliminary) 1,175, 1,199, 1,218 9,598, 10,484, 10,774 Worst month (both years) November (571) November (4,330) Worst hour, October and November 6 pm to 7 pm (92) 6 pm to 7 pm 5 pm to 8 pm share, October and November 24.8 percent 28 percent In the dark, October and November 66.7 percent 66 percent Someone hurt or killed 115 crashes (4.8 percent) 914 (4.6 percent) Top road for animal crashes Garden State Parkway (345)Clocks back: 5 pm to 8 pm, two weeks before and after 63 to 105 582 to 900 Monday after the clocks fell back (2023, 2024) 21 and 15, against 8.0 on an average fall day 120 and 127
Top 5 Monmouth towns for October and November animal crashes, 2023 and 2024
Bars show Animal crashes, two years
Wall Township 265 Marlboro Township 241 Middletown Township 238 Freehold Township 201 Holmdel Township 165 See the full table Swipe for more columns →
Top 5 Monmouth towns for October and November animal crashes, 2023 and 20241 Town October and November Animal crashes, two years All crashes Animal share Middletown Township 112 238 2,822 8.4 percent Marlboro Township 111 241 1,750 13.8 percent Wall Township 109 265 3,193 8.3 percent Holmdel Township 83 165 1,060 15.6 percent Freehold Township 80 201 1,991 10.1 percent
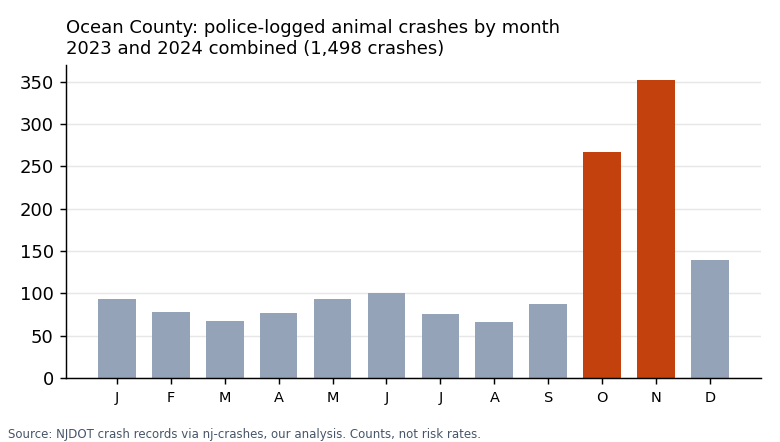
Monmouth County animal crashes by month, 2023 and 2024 combined. October and November in orange. Our NJDOT count. Ocean County Evening animal crashes doubled after the clocks fell back: 31 from 5 pm to 8 pm in the two weeks before, 64 after. The clocks went back again on 1 November 2026. Toms River's 104 fall animal crashes rank 8th in the state. In Manchester, 16.7 percent of crashes involved an animal. Ocean County at a glance, 2023 and 2024 (our count) Measure Ocean New Jersey Animal crashes, 2023 and 2024 1,498 20,082 Animal share of all crashes 5.1 percent (11th of 21) 3.9 percent In October and November 619 (41.3 percent) 8,140 (41 percent) 2023, 2024, 2025 (preliminary) 749, 749, 708 9,598, 10,484, 10,774 Worst month (both years) November (352) November (4,330) Worst hour, October and November 6 pm to 7 pm (59) 6 pm to 7 pm 5 pm to 8 pm share, October and November 24.6 percent 28 percent In the dark, October and November 64.8 percent 66 percent Someone hurt or killed 73 crashes (4.9 percent) 914 (4.6 percent) Top road for animal crashes Garden State Parkway (181)Clocks back: 5 pm to 8 pm, two weeks before and after 31 to 64 582 to 900 Monday after the clocks fell back (2023, 2024) 10 and 10, against 5.1 on an average fall day 120 and 127
Top 5 Ocean towns for October and November animal crashes, 2023 and 2024
Bars show Animal crashes, two years
Manchester Township 247 Toms River Township 207 Jackson Township 184 Berkeley Township 141 Barnegat Township 121 See the full table Swipe for more columns →
Top 5 Ocean towns for October and November animal crashes, 2023 and 20241 Town October and November Animal crashes, two years All crashes Animal share Toms River Township 104 207 6,107 3.4 percent Manchester Township 86 247 1,479 16.7 percent Jackson Township 83 184 1,944 9.5 percent Berkeley Township 50 141 1,379 10.2 percent Barnegat Township 47 121 917 13.2 percent
Ocean County animal crashes by month, 2023 and 2024 combined. October and November in orange. Our NJDOT count. How do deer crashes compare across South Jersey counties? Burlington has the most animal crashes in the south, Gloucester the sharpest fall peak and Salem the highest share of all crashes.
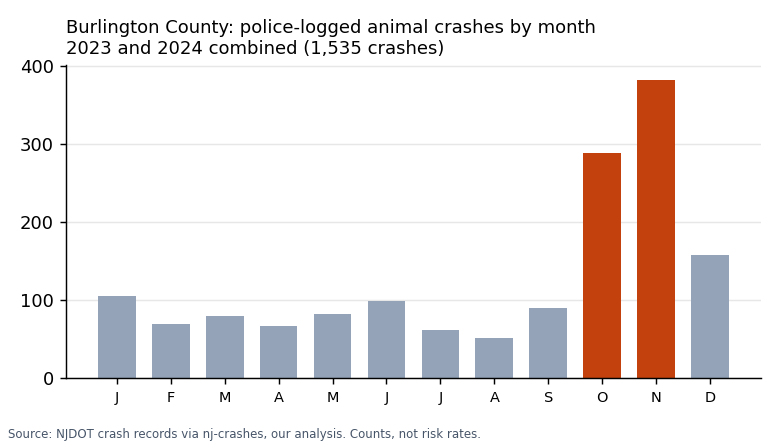
Burlington County Up three years running, to 898 in preliminary 2025: a 13.5 percent rise, 3rd biggest of 21 counties. Mount Laurel's 109 fall animal crashes tie for the 5th most of any NJ town. In Medford, 16.5 percent of its 1,207 crashes involved an animal. Burlington County at a glance, 2023 and 2024 (our count) Measure Burlington New Jersey Animal crashes, 2023 and 2024 1,535 20,082 Animal share of all crashes 6.9 percent (7th of 21) 3.9 percent In October and November 670 (43.6 percent) 8,140 (41 percent) 2023, 2024, 2025 (preliminary) 744, 791, 898 9,598, 10,484, 10,774 Worst month (both years) November (382) November (4,330) Worst hour, October and November 6 pm to 7 pm (74) 6 pm to 7 pm 5 pm to 8 pm share, October and November 28.5 percent 28 percent In the dark, October and November 65.2 percent 66 percent Someone hurt or killed 63 crashes (4.1 percent) 914 (4.6 percent) Top road for animal crashes Route 206 (108)Clocks back: 5 pm to 8 pm, two weeks before and after 53 to 64 582 to 900 Monday after the clocks fell back (2023, 2024) 11 and 12, against 5.5 on an average fall day 120 and 127
Top 5 Burlington towns for October and November animal crashes, 2023 and 2024
Bars show Animal crashes, two years
Mount Laurel Township 212 Medford Township 199 Pemberton Township 128 Evesham Township 115 Southampton Township 108 See the full table Swipe for more columns →
Top 5 Burlington towns for October and November animal crashes, 2023 and 20241 Town October and November Animal crashes, two years All crashes Animal share Mount Laurel Township 109 212 3,199 6.6 percent Medford Township 92 199 1,207 16.5 percent Evesham Township 56 115 1,382 8.3 percent Pemberton Township 45 128 945 13.5 percent Southampton Township 43 108 673 16.0 percent
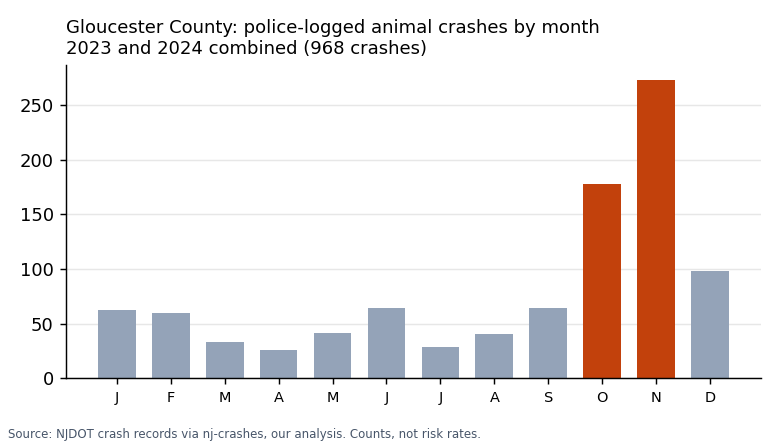
Burlington County animal crashes by month, 2023 and 2024 combined. October and November in orange. Our NJDOT count. Gloucester County 46.6 percent of animal crashes fall in October and November, the sharpest fall season of any NJ county. Evening animal crashes doubled after the clocks went back, 34 to 69. Gloucester County at a glance, 2023 and 2024 (our count) Measure Gloucester New Jersey Animal crashes, 2023 and 2024 968 20,082 Animal share of all crashes 6.1 percent (8th of 21) 3.9 percent In October and November 451 (46.6 percent) 8,140 (41 percent) 2023, 2024, 2025 (preliminary) 538, 430, 461 9,598, 10,484, 10,774 Worst month (both years) November (273) November (4,330) Worst hour, October and November 6 pm to 7 pm (59) 6 pm to 7 pm 5 pm to 8 pm share, October and November 33.7 percent 28 percent In the dark, October and November 71.0 percent 66 percent Someone hurt or killed 53 crashes (5.5 percent) 914 (4.6 percent) Top road for animal crashes Route 55 (94)Clocks back: 5 pm to 8 pm, two weeks before and after 34 to 69 582 to 900 Monday after the clocks fell back (2023, 2024) 8 and 8, against 3.7 on an average fall day 120 and 127
Top 5 Gloucester towns for October and November animal crashes, 2023 and 2024
Bars show Animal crashes, two years
Monroe Township 165 Franklin Township 137 Washington Township 128 Deptford Township 80 Elk Township 77 See the full table Swipe for more columns →
Top 5 Gloucester towns for October and November animal crashes, 2023 and 20241 Town October and November Animal crashes, two years All crashes Animal share Monroe Township 89 165 1,764 9.4 percent Washington Township 62 128 2,804 4.6 percent Franklin Township 54 137 1,230 11.1 percent Deptford Township 39 80 2,386 3.4 percent Elk Township 29 77 383 20.1 percent
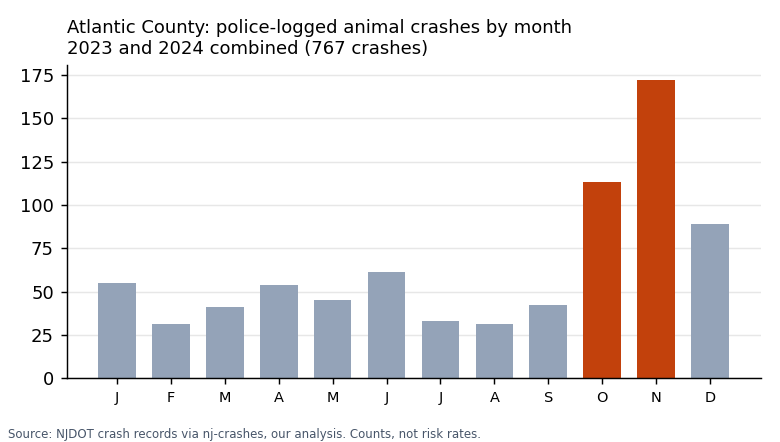
Gloucester County animal crashes by month, 2023 and 2024 combined. October and November in orange. Our NJDOT count. Atlantic County Galloway logged the most. In Mullica, 28 percent of crashes involve an animal, against 4.8 percent countywide. 5 pm to 6 pm is the worst fall hour. Atlantic County at a glance, 2023 and 2024 (our count) Measure Atlantic New Jersey Animal crashes, 2023 and 2024 767 20,082 Animal share of all crashes 4.8 percent (12th of 21) 3.9 percent In October and November 285 (37.2 percent) 8,140 (41 percent) 2023, 2024, 2025 (preliminary) 380, 387, 333 9,598, 10,484, 10,774 Worst month (both years) November (172) November (4,330) Worst hour, October and November 5 pm to 6 pm (32) 6 pm to 7 pm 5 pm to 8 pm share, October and November 26.0 percent 28 percent In the dark, October and November 61.8 percent 66 percent Someone hurt or killed 39 crashes (5.1 percent) 914 (4.6 percent) Top road for animal crashes Garden State Parkway (58)Monday after the clocks fell back (2023, 2024) 1 and 5, against 2.3 on an average fall day 120 and 127
Top 5 Atlantic towns for October and November animal crashes, 2023 and 2024
Bars show Animal crashes, two years
Galloway Township 183 Egg Harbor Township 143 Hamilton Township 140 Mullica Township 85 Hammonton Town 52 See the full table Swipe for more columns →
Top 5 Atlantic towns for October and November animal crashes, 2023 and 20241 Town October and November Animal crashes, two years All crashes Animal share Galloway Township 72 183 1,599 11.4 percent Hamilton Township 61 140 1,839 7.6 percent Egg Harbor Township 44 143 3,864 3.7 percent Hammonton Town 27 52 889 5.8 percent Mullica Township 24 85 303 28.1 percent
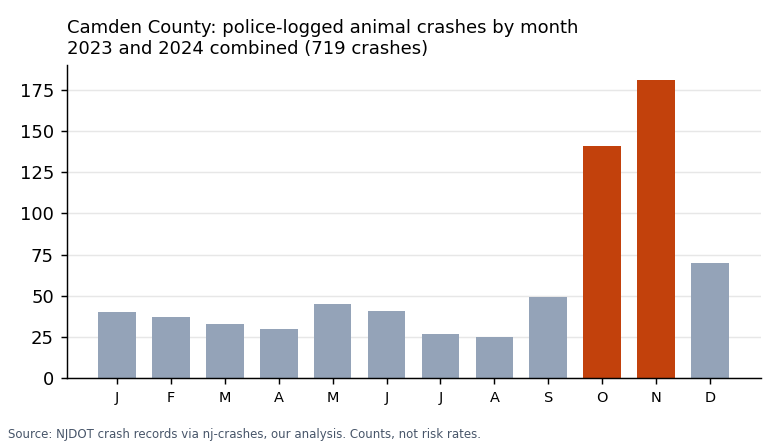
Atlantic County animal crashes by month, 2023 and 2024 combined. October and November in orange. Our NJDOT count. Camden County 45 percent come in October and November, 2nd highest share in the state. Evening animal crashes rose from 17 to 40 after the clocks fell back. 6.3 percent of animal crashes hurt someone, joint 2nd highest of any county (statewide 4.6 percent). Camden County at a glance, 2023 and 2024 (our count) Measure Camden New Jersey Animal crashes, 2023 and 2024 719 20,082 Animal share of all crashes 2.6 percent (15th of 21) 3.9 percent In October and November 322 (44.8 percent) 8,140 (41 percent) 2023, 2024, 2025 (preliminary) 310, 409, 450 9,598, 10,484, 10,774 Worst month (both years) November (181) November (4,330) Worst hour, October and November 7 pm to 8 pm (36) 6 pm to 7 pm 5 pm to 8 pm share, October and November 27.0 percent 28 percent In the dark, October and November 71.7 percent 66 percent Someone hurt or killed 45 crashes (6.3 percent) 914 (4.6 percent) Top road for animal crashes Route 73 (66)Clocks back: 5 pm to 8 pm, two weeks before and after 17 to 40 582 to 900 Monday after the clocks fell back (2023, 2024) 5 and 4, against 2.6 on an average fall day 120 and 127
Top 5 Camden towns for October and November animal crashes, 2023 and 2024
Bars show Animal crashes, two years
Winslow Township 175 Cherry Hill Township 165 Gloucester Township 92 Voorhees Township 72 Waterford Township 54 See the full table Swipe for more columns →
Top 5 Camden towns for October and November animal crashes, 2023 and 20241 Town October and November Animal crashes, two years All crashes Animal share Cherry Hill Township 86 165 5,514 3.0 percent Winslow Township 76 175 1,913 9.1 percent Gloucester Township 46 92 2,318 4.0 percent Waterford Township 23 54 335 16.1 percent Voorhees Township 22 72 1,341 5.4 percent
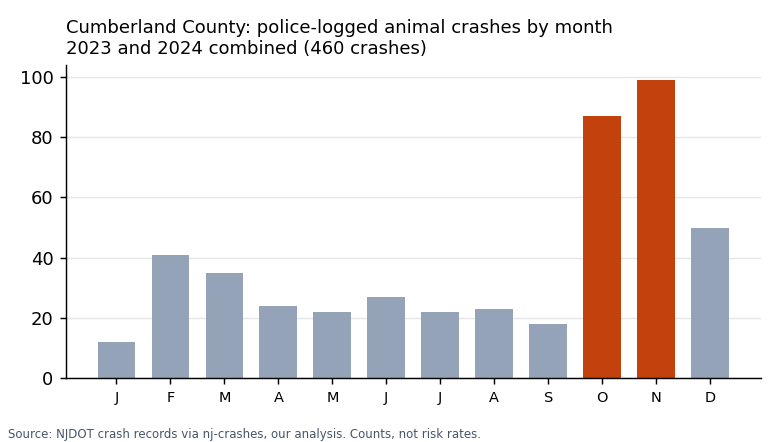
Camden County animal crashes by month, 2023 and 2024 combined. October and November in orange. Our NJDOT count. Cumberland County Animal crashes hurt someone 6.3 percent of the time, joint 2nd highest of 21 counties (statewide 4.6 percent), with 32 people hurt. Vineland logs the most. Cumberland County at a glance, 2023 and 2024 (our count) Measure Cumberland New Jersey Animal crashes, 2023 and 2024 460 20,082 Animal share of all crashes 6.1 percent (8th of 21) 3.9 percent In October and November 186 (40.4 percent) 8,140 (41 percent) 2023, 2024, 2025 (preliminary) 221, 239, 238 9,598, 10,484, 10,774 Worst month (both years) November (99) November (4,330) Worst hour, October and November 6 pm to 7 pm (19) 6 pm to 7 pm 5 pm to 8 pm share, October and November 24.2 percent 28 percent In the dark, October and November 68.3 percent 66 percent Someone hurt or killed 29 crashes (6.3 percent) 914 (4.6 percent) Top road for animal crashes Route 47 (31) Monday after the clocks fell back (2023, 2024) 2 and 4, against 1.5 on an average fall day 120 and 127
Top 5 Cumberland towns for October and November animal crashes, 2023 and 2024
Bars show Animal crashes, two years
Vineland City 127 Upper Deerfield Township 67 Millville City 64 Maurice River Township 42 Deerfield Township 30 See the full table Swipe for more columns →
Top 5 Cumberland towns for October and November animal crashes, 2023 and 20241 Town October and November Animal crashes, two years All crashes Animal share Vineland City 61 127 3,641 3.5 percent Upper Deerfield Township 26 67 609 11.0 percent Millville City 26 64 1,451 4.4 percent Maurice River Township 19 42 307 13.7 percent Deerfield Township 12 30 211 14.2 percent
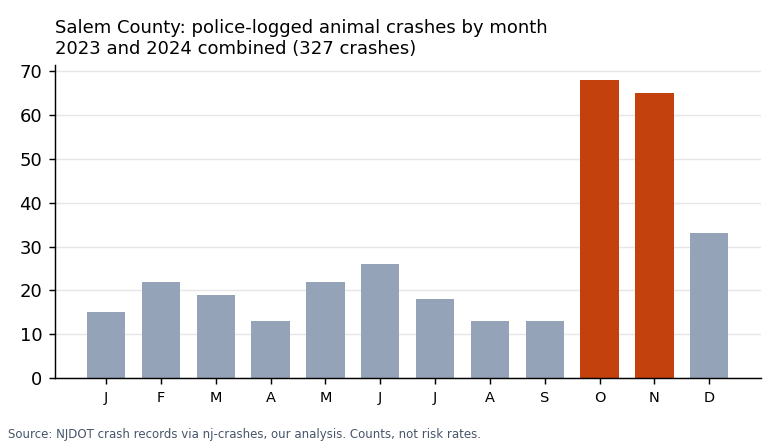
Cumberland County animal crashes by month, 2023 and 2024 combined. October and November in orange. Our NJDOT count. Salem County About 1 in 10 crashes involves an animal, 4th highest of 21 counties (statewide 3.9 percent). In Pittsgrove it is about 1 in 6. Nearly a third of fall animal crashes come in the evening rush. Salem County at a glance, 2023 and 2024 (our count) Measure Salem New Jersey Animal crashes, 2023 and 2024 327 20,082 Animal share of all crashes 10.1 percent (4th of 21) 3.9 percent In October and November 133 (40.7 percent) 8,140 (41 percent) 2023, 2024, 2025 (preliminary) 151, 176, 186 9,598, 10,484, 10,774 Worst month (both years) October (68) November (4,330) Worst hour, October and November 6 pm to 7 pm (22) 6 pm to 7 pm 5 pm to 8 pm share, October and November 31.6 percent 28 percent In the dark, October and November 69.9 percent 66 percent Someone hurt or killed 18 crashes (5.5 percent) 914 (4.6 percent) Top road for animal crashes Route 40 (28) Monday after the clocks fell back (2023, 2024) 4 and 2, against 1.1 on an average fall day 120 and 127
Top 5 Salem towns for October and November animal crashes, 2023 and 2024
Bars show Animal crashes, two years
Pittsgrove Township 64 Pilesgrove Township 47 Carneys Point Township 39 Mannington Township 37 Upper Pittsgrove Township 35 See the full table Swipe for more columns →
Top 5 Salem towns for October and November animal crashes, 2023 and 20241 Town October and November Animal crashes, two years All crashes Animal share Carneys Point Township 24 39 712 5.5 percent Pittsgrove Township 23 64 388 16.5 percent Upper Pittsgrove Township 21 35 424 8.3 percent Pilesgrove Township 12 47 300 15.7 percent Mannington Township 12 37 137 27.0 percent
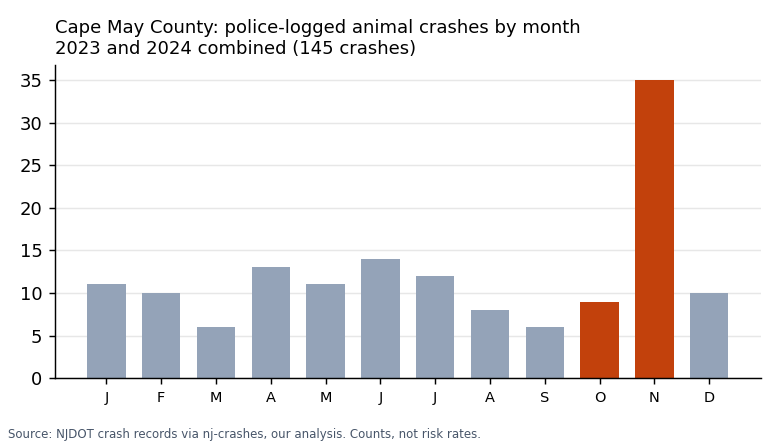
Salem County animal crashes by month, 2023 and 2024 combined. October and November in orange. Our NJDOT count. Cape May County Preliminary 2025: 82 animal crashes against 65 in 2024, up 26 percent, the biggest rise of 21 counties. Only 30 percent come in October and November, 2nd lowest in NJ (statewide 41 percent). Cape May County at a glance, 2023 and 2024 (our count) Measure Cape May New Jersey Animal crashes, 2023 and 2024 145 20,082 Animal share of all crashes 3.0 percent (14th of 21) 3.9 percent In October and November 44 (30.3 percent) 8,140 (41 percent) 2023, 2024, 2025 (preliminary) 80, 65, 82 9,598, 10,484, 10,774 Worst month (both years) November (35) November (4,330) Worst hour, October and November 6 pm to 7 pm (6) 6 pm to 7 pm 5 pm to 8 pm share, October and November 27.3 percent 28 percent In the dark, October and November 54.5 percent 66 percent Someone hurt or killed 4 crashes (2.8 percent) 914 (4.6 percent) Top road for animal crashes Garden State Parkway (39)
Top 4 Cape May towns for October and November animal crashes, 2023 and 2024
Bars show Animal crashes, two years
Middle Township 47 Upper Township 40 Dennis Township 33 Lower Township 9 See the full table Swipe for more columns →
Top 4 Cape May towns for October and November animal crashes, 2023 and 20241 Town October and November Animal crashes, two years All crashes Animal share Middle Township 16 47 1,210 3.9 percent Upper Township 14 40 514 7.8 percent Dennis Township 13 33 441 7.5 percent Lower Township 1 9 647 1.4 percent
Cape May County animal crashes by month, 2023 and 2024 combined. October and November in orange. Our NJDOT count. Questions people ask Are there deer in New Jersey? Yes, in every county. Police logged animal crashes in all 21 counties in 2023 and 2024, from 74 in Hudson to 2,374 in Monmouth.
What month has the most deer accidents? November statewide. By county, November was the worst month in 11 counties and October in 9; Hudson's peak was May.
Which NJ town has the most deer crashes in the fall? Bridgewater in Somerset, with 117 in October and November of 2023 and 2024. Raritan Township in Hunterdon (115) and Middletown in Monmouth (112) were next.
What time are deer crashes worst? In 13 of the 21 counties, 6 pm to 7 pm was the worst October and November hour. All crash types by hour are on when most car accidents happen in New Jersey , and county totals on our NJ car accident statistics .1
Hurt in a crash with a deer or another car in New Jersey? Answer a few short questions, about 30 seconds, to see if a lawyer's office may review your claim for free.
Start the New Jersey accident quiz
Advertisement. Opens the New Jersey questionnaire. Review its policies and contact consent before submitting your details. No legal advice or guarantee of acceptance or compensation.
Sources NJDOT police crash records, crash type "Animal", via the NJDOT Crash Data Portal as normalized by the open-source nj-crashes project; our count, 2023 and 2024 complete, 2025 preliminary. Retrieved 2026-11-06. How we counted Our count of NJDOT police crash records. "Animal crash" means crash type "Animal". 2023 and 2024 are complete; 2025 is preliminary and may change. County and town are as coded on the crash record. Town shares quoted in the text use towns with at least 300 crashes, except West Amwell and East Amwell (small bases, stated). Top road groups road names on the record (for example, every way Route 206 is written). Worst hour, dusk (5 pm to 7:59 pm) and dark shares use October and November only. Clocks back: animal crashes from 5 pm to 8 pm in the two weeks before and after each fall time change, 2023 and 2024 added together, shown where the before count is 15 or more. The change falls inside the deer rut, so this shows when crashes cluster, not a cause. Counts of police reports, not risk rates; crashes never reported to police are missing. They say nothing about fault or claim value. General information, not legal advice; Injuries Cases Autos is not a law firm.